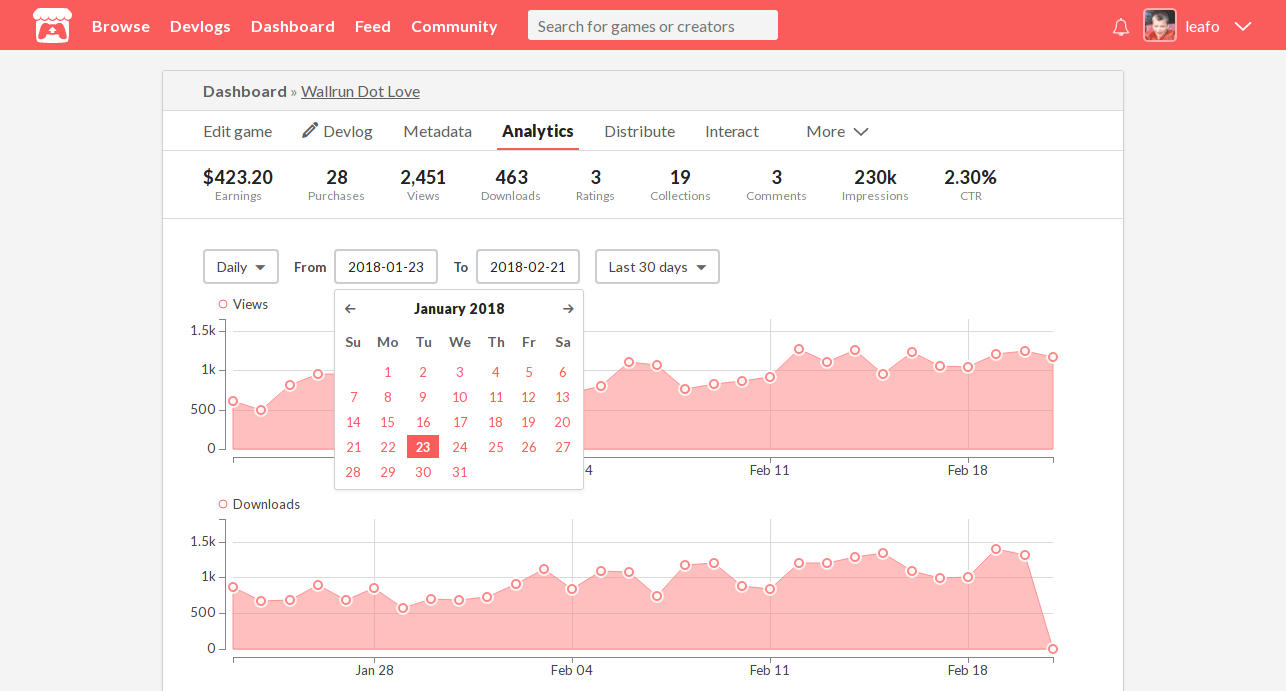
We’ve updated the project page analytics with some new features and additional data. Take a look!
New header & navigation
The navigation on all project edit pages has been updated. We’ve visually cleaned up some noise and removed the redundant page title to make things more compact.
See what collections your project is in
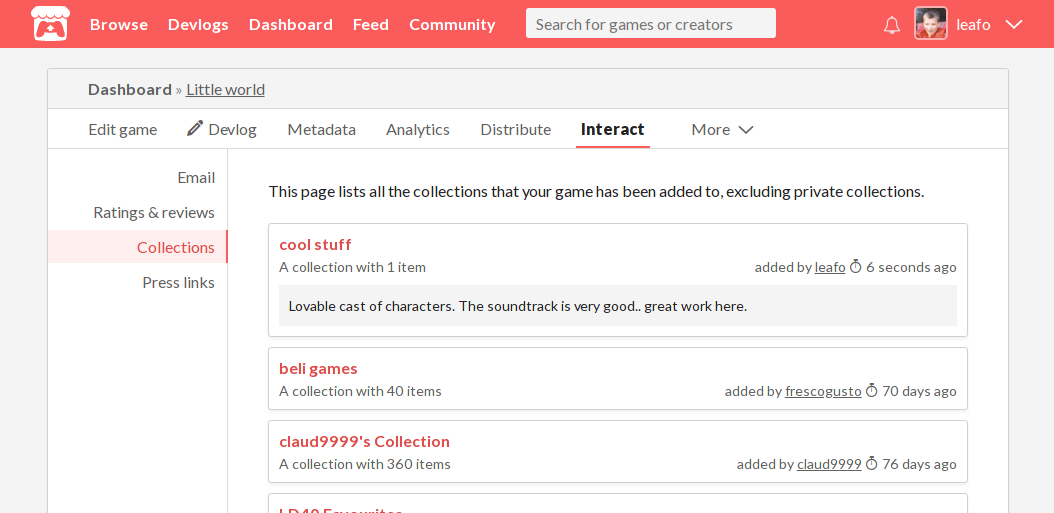
From Interact tab on the project edit page there’s a new Collections tab (below Ratings & Reviews) that lets you see all the public collections your project has been added to. Use it to see what kinds of projects people are putting yours with. You might even find something new to play!
Graph time periods and weekly aggregation for graphs
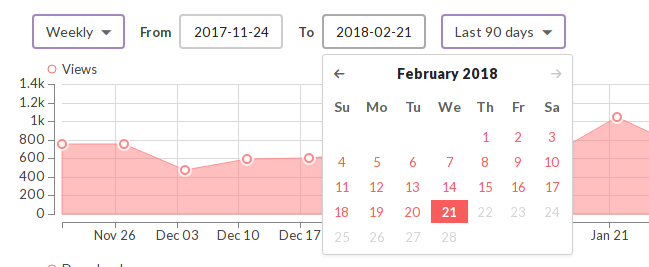
The controls we used to have on our project analytics graphs left much to be desired. We’ve updated the interface to make it easier to explore your stats. You can now pick dates freely (up to 1 year in length), or use one of the preset time periods. Additionally, you can aggregate counts by week in addition to daily.
More metrics
We’ve consolidated and added some new metrics to top of the project analytics page. Here’s the full list of changes:
- Collections — How many collections your project has been added to. You can click this to go directly to the collections page mentioned above
- Comments — You can now see how many comments you’ve gotten at a quick glance
- Ratings — How many ratings your project has received. You can click this to go to the ratings list
- Impressions — This is a new metric we’re releasing with this update, and it’s explained below
- CTR — Your click through rate related to impressions, see below
Impressions and CTR
In order to give you more visibility around how much exposure itch.io gives your project page, we’re now showing Impressions and CTR on your analytics page. Unlike the other metrics, these only account for the last week of data. An impression is incremented every time itch.io shows your project title and thumbnail to someone when browsing our site. This includes pages like the homepage, the feed, recommendations, and our browse pages. The CTR, or click through rate, represents the frequency an impression ended up in someone clicking through to your page. (Note some pages may not have Impressions & CTR if the data is too low)
We hope you can use this new data to experiment with how you manage your page. A easy way to help boost impressions is to correctly tag and classify your game, since it will then have more opportunities to show up on other pages. Don’t forget to fill out all the optional fields on the metadata tab.
Enjoy the updates,
If you have ideas for other analytics you’d like us to make available leave a comment.

